
How to Read a T12 for a Multifamily Deal (8 Checks Before You Trust It)
The short answer: A T12 (trailing 12 months) is the property's actual income and expenses for the last 12 months, month by month. To read one well, check that it is complete, look for trends and spikes, use recent income (T3) with full-year expenses (T12), test income quality, compare expenses per unit, reset taxes and insurance for a new owner, pull out one-time items, and tie it to the rent roll.
That is the whole job. The rest of this article shows you how I do each step, and the numbers I use.
The offering memorandum tells the story.
The T12 tells you what actually happened.
But here is the catch. Just because it is a T12 does not mean it is accurate. The categories are whatever the property manager set up. Some lines are missing. Some are in the wrong place. Some months have spikes that have nothing to do with how the property really runs.
So don't just read the T12. Pressure-test it.
What is on a T12
A T12 has one column per month, plus a total. Most have 14 columns: the line name, 12 months, and the 12-month total.
Section | Typical lines |
|---|---|
Income | Gross potential rent, loss to lease, vacancy, concessions, bad debt, other income (late fees, RUBS utility billing, pet fees, parking) |
Expenses | Payroll, repairs and maintenance, make-ready, contract services, utilities, management fee, marketing, admin, insurance, property taxes |
Bottom line | Net operating income (NOI) = effective gross income minus operating expenses |
Check 1: Make sure it is really 12 months, and it adds up
Count the months. A "T12" that is really six months of data shows up more often than you would think.
Then add up the months yourself and compare to the total column. Small rounding gaps are fine. A gap of a few thousand dollars on a $3 million income line is fine. A gap of a few hundred thousand is not.
Check 2: Color the months and look for the trend
This is the fastest way I know to read a T12.
In Excel, select each key row (rental income, other income, effective gross income, total expenses and NOI) and add a conditional-format color scale. Green on top for income. Red on top for expenses.
Now the story jumps out at you…
NOI that goes from green to red over the year is a red flag.
Income that spikes in the last two or three months, right before the property was listed, deserves a hard question.
Utilities that move with the seasons (gas in winter, water in summer) are normal. Utilities that only go up are not.
Flag what you see and keep moving. Underwriting is an iterative process. You will come back to these flags.
Check 3: Use the right time period
You will see T1, T3, T6 and T12 numbers:
T1 = last month × 12
T3 = last 3 months × 4
T6 = last 6 months × 2
T12 = the full 12 months
My rule: use T3 income and T12 expenses.
Income tells you where the property is now, so recent months matter most. Expenses are lumpy. Many owners pay taxes and insurance in a single month. If you annualize three months of expenses, you can miss them completely… or count them four times.
T12 expenses smooth out those spikes.
An example. Here is a 176-unit sample property in MFA-ADVANCED. On the last three months, the expense ratio is 33%. On the full twelve months, it is 49%. Same property. Sixteen points apart.
Look at November. One big expense month pushed operating expenses past $300,000 and turned NOI negative for that month. That is the kind of bill that is paid once a year. A T3 that skips that month would make this deal look far better than it is.
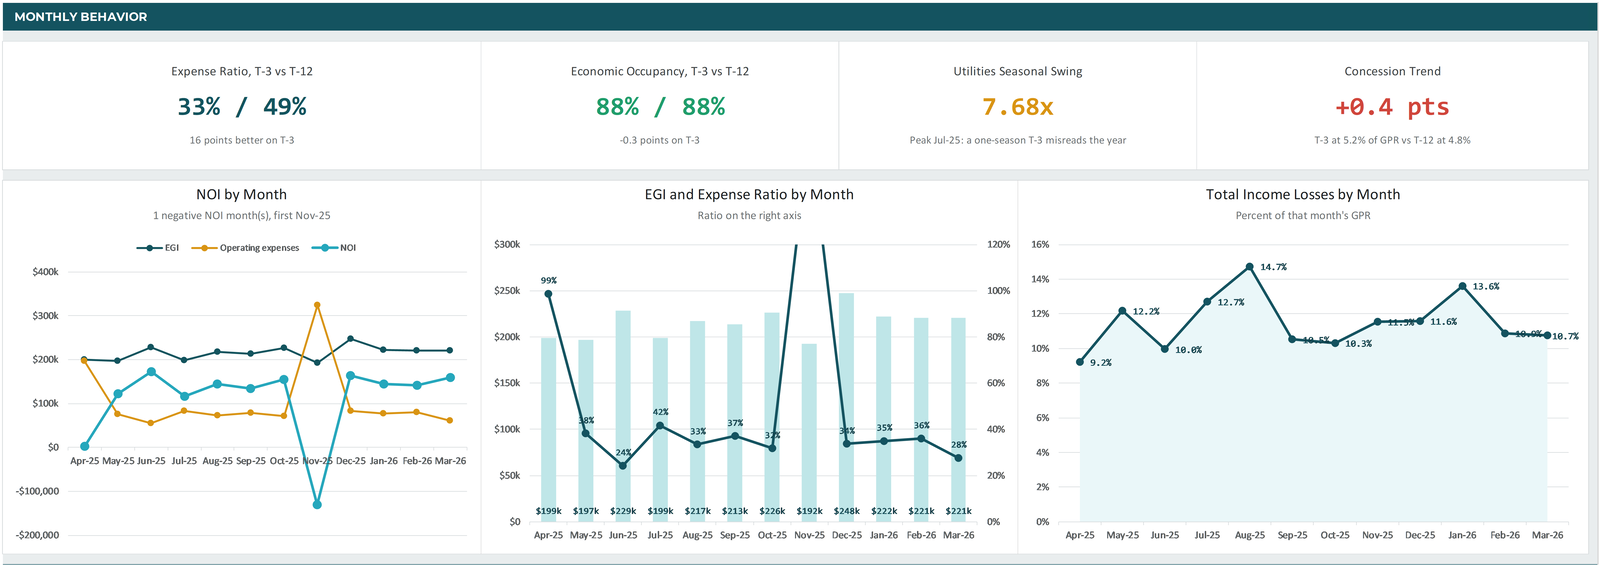
Utilities tell the same story. On this property, the peak month (July) was 7.68 times the lowest month. If your three months happen to be summer, you overstate utilities for the whole year. If they are spring, you understate them.
Check 4: Test the quality of the income
Not all income is equal. You could definitely make a deal look good with other income.
These are the ranges I use:
Bad debt: about 1% of gross potential rent is a healthy target. Much higher tells you about the tenant base.
Concessions: 1–2% is normal. Heavy concessions mean either a soft market or rents set too high.
Late fees: under 0.25% of gross potential rent is excellent. Over 1.5% is a flag. I don't underwrite late fees at face value above about 1%, because they usually travel with bad debt.
RUBS (utility billing back to tenants): a recovery ratio around 80–90% of the utility cost is normal. Over 100% means tenants are being over-billed, and I don't underwrite that income.
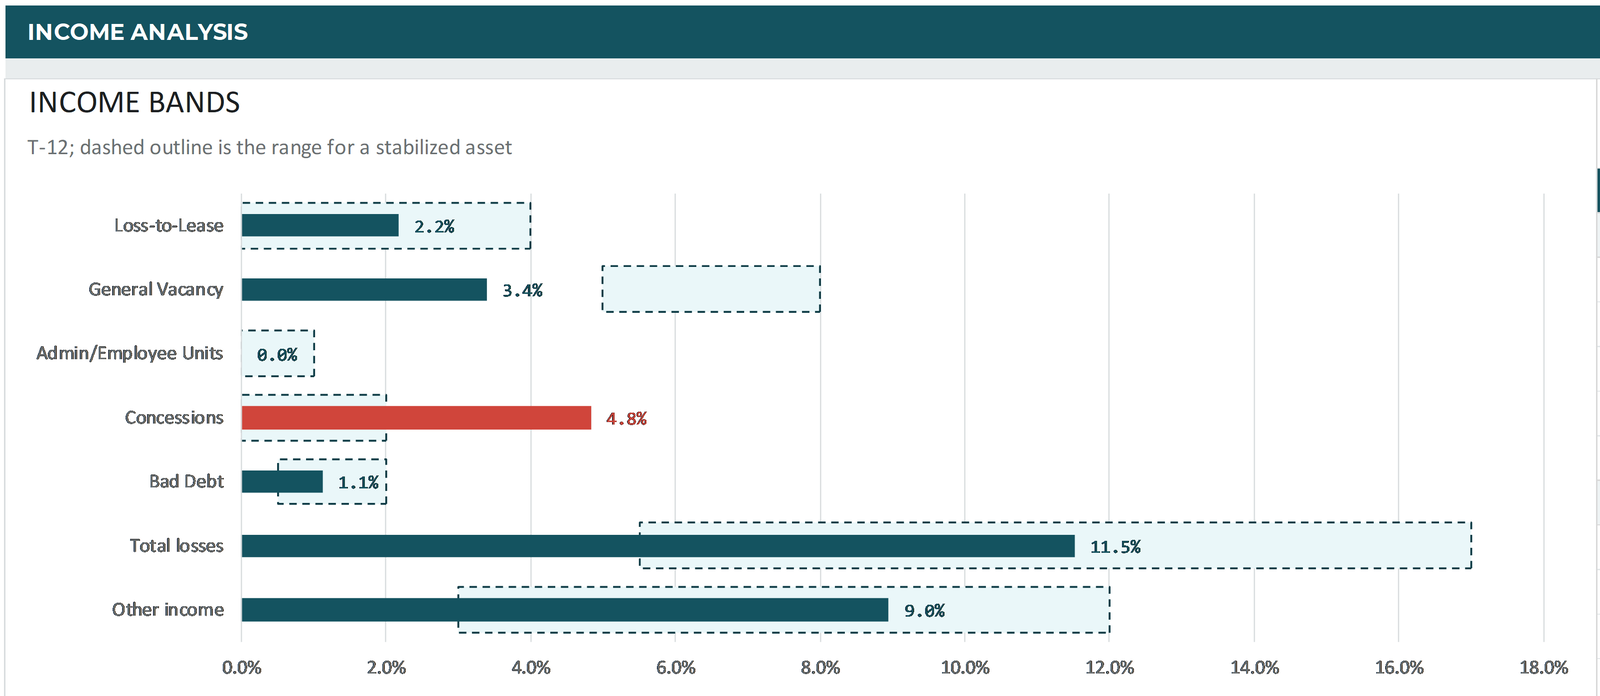
On the same 176-unit property: concessions run 4.8% of gross potential rent. That is well above the 1–2% I expect, so MFA-ADVANCED flags it in red. And the trend is getting worse, not better: 5.2% on the last three months against 4.8% for the year. Bad debt (1.1%), other income (9.0%) and the RUBS recovery ratio (85%) are all in a normal range.
So the question for this deal is simple. Why does this property need so many concessions to stay full?
Also look for income in odd places. Prepaid rent and past-due collections sometimes show up as "income adjustments." Vacancy and credit loss are sometimes lumped together. Sort them out before you trust the totals.
Check 5: Compare expenses per unit, not as a ratio
Expense ratio (expenses ÷ income) is the number everyone quotes. Just be careful with it.
Here is why. I once looked at a property at 80% occupancy with an 86% expense ratio. That looks like a disaster. But on a per-unit basis, the expenses were completely normal. The problem was the income, not the expenses.
So compare each expense line per unit per year. As a rough guide from the T12s I have seen:
Payroll: about $1,400 to $2,000 per unit
Total operating expenses: about $7,000 to $10,000 per unit, higher in states with heavy property taxes like Texas
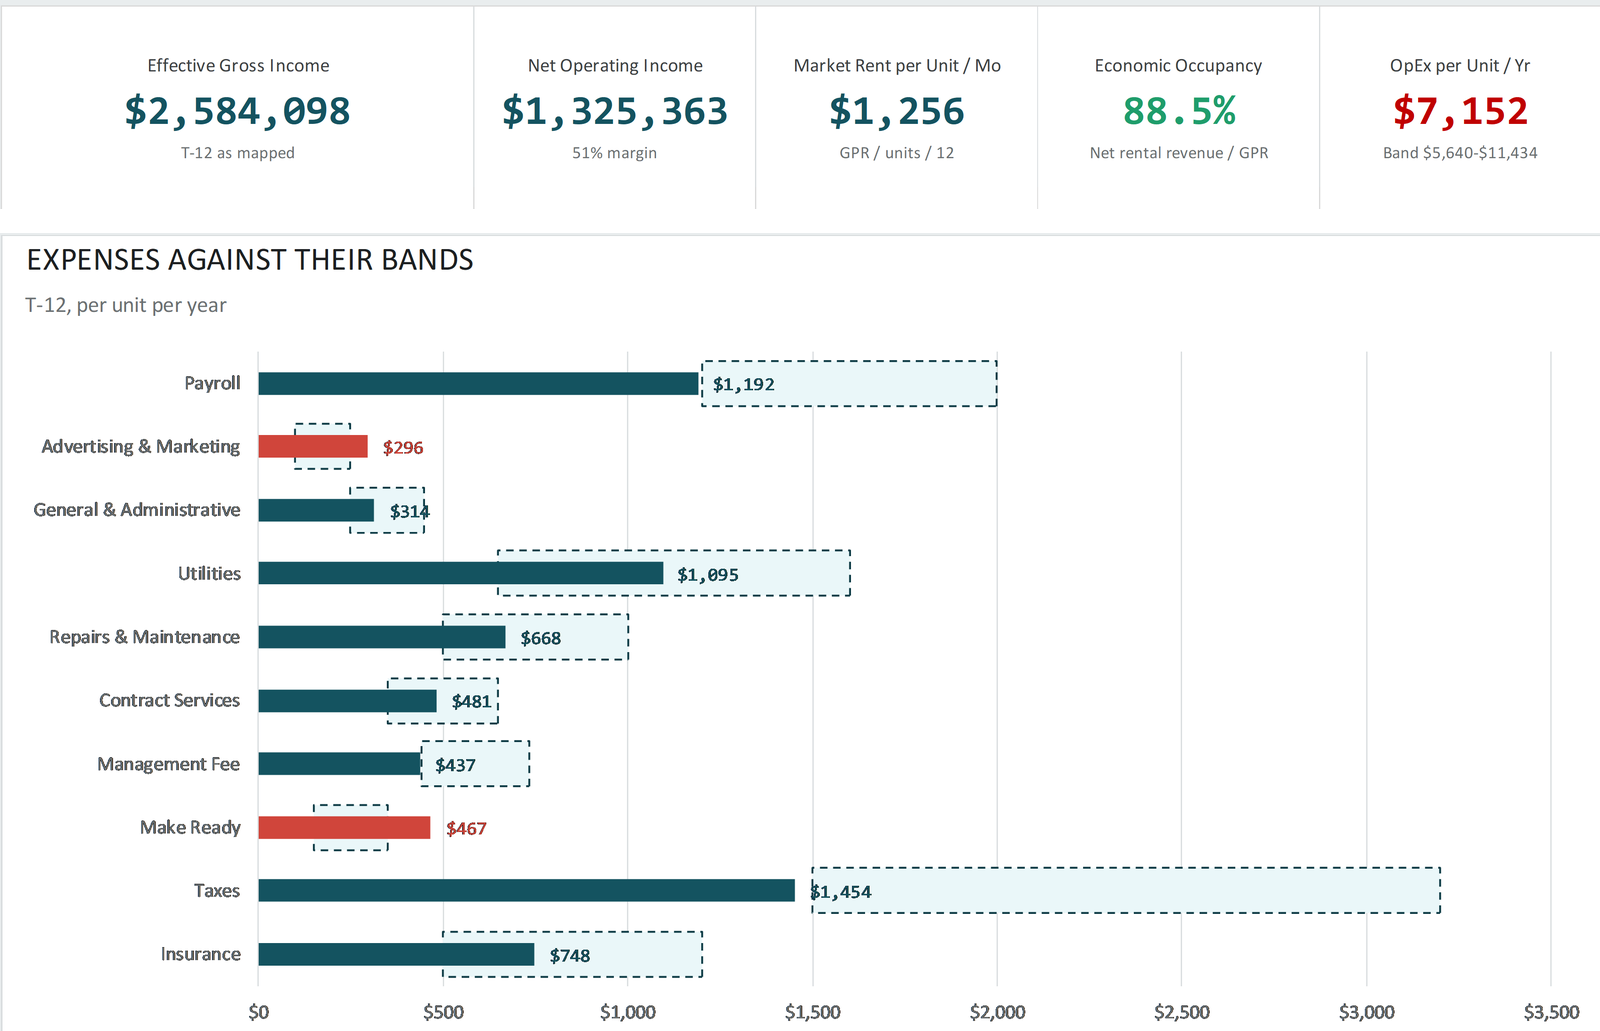
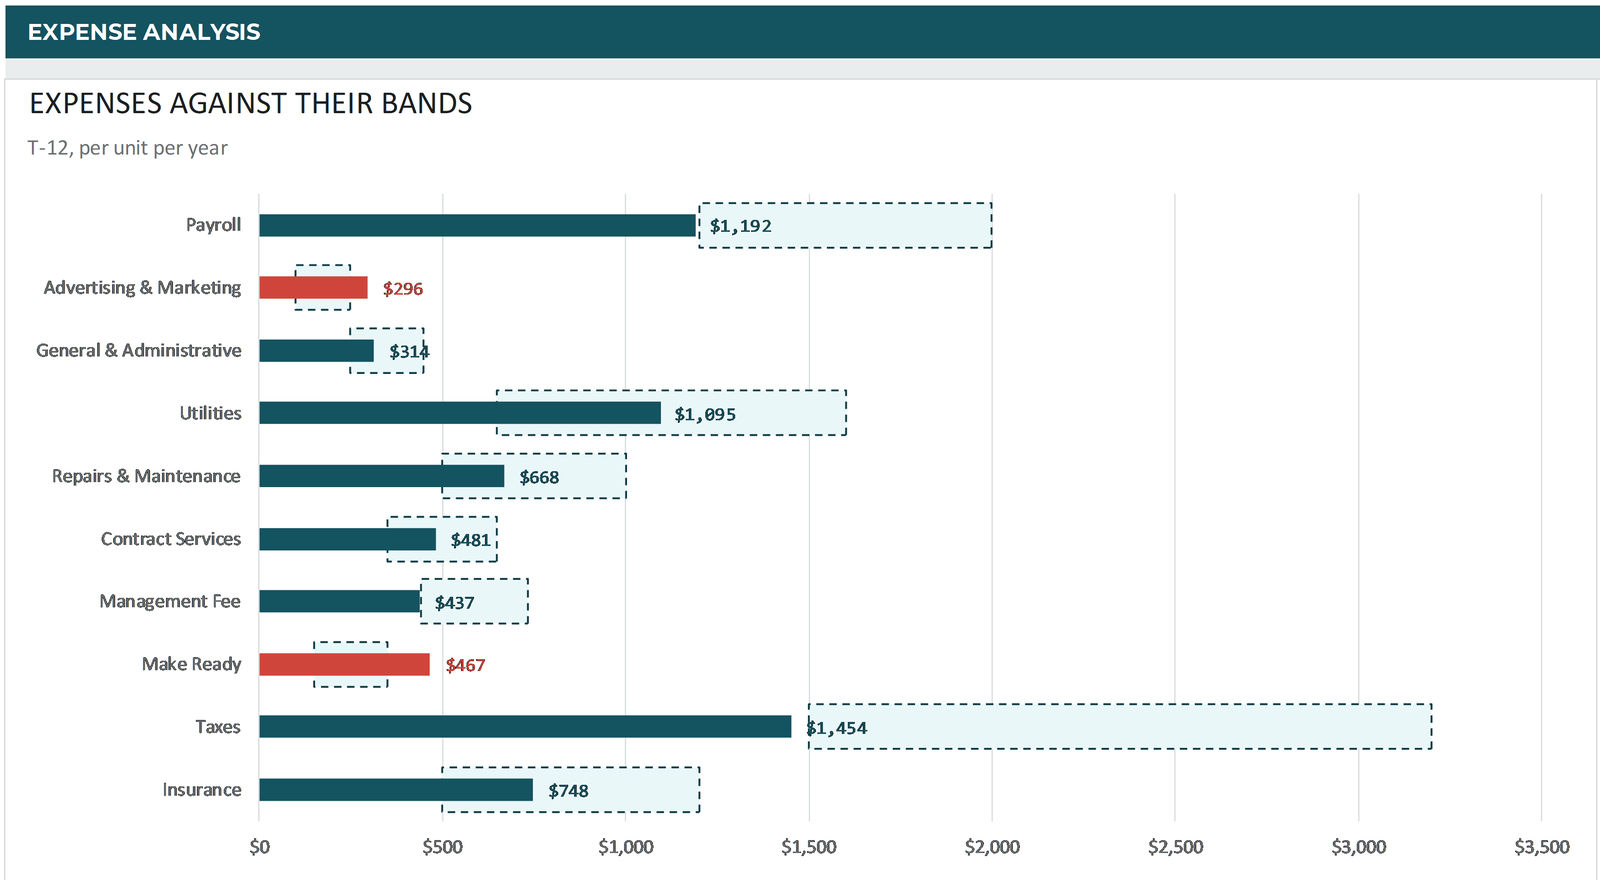
On the same property: total operating expenses are $7,152 per unit per year, right in the normal range. But two lines run hot: advertising and marketing ($296 per unit) and make-ready ($467 per unit). Put those next to the high concessions from Check 4, and you see one story… this property is working hard and spending money to fill units.
That is a question for the broker and the property manager. And it is exactly what the T12 is for.
Better yet, build your own benchmark list from every T12 you underwrite. After a dozen deals in one market, you will spot an odd line in seconds.
Check 6: Reset what changes when you buy
The T12 shows the seller's costs. Some of them will not be your costs.
Property taxes: many counties reassess at sale. If the T12 taxes are based on the old assessed value, your taxes will likely go up.
Insurance: a year-old policy is not a quote. Get a current quote for your ownership.
Management fee: use the fee you will actually pay.
These three lines alone can turn a good-looking deal into a thin one.
On the 176-unit example, taxes are $1,454 per unit, at the very bottom of the normal range. When taxes sit that low, I assume a reassessment is coming and underwrite the higher number.
Check 7: Pull out one-time items and wrong categories
Look for:
Capital items booked as repairs. A big one-time charge in repairs and maintenance is often a roof, a boiler or a parking lot.
Deferred maintenance. Very little make-ready or repair spending before a sale can mean work was put off.
Zeros in contract services. Months with nothing posted can mean bills that were not paid or not entered. Ask for the accounts payable report.
Lines in the wrong place. Marketing in admin, pest control in maintenance, utility reimbursements inside expenses.
Missing lines. No vacancy, no bad debt, no loss to lease. Common with self-managed owners.
When a month is clearly an outlier, don't just use the raw total. Take the average of the normal months and multiply by 12.
Check 8: Tie the T12 to the rent roll
The T12 and the rent roll should tell the same story. The gross potential rent on the T12 should line up with the market rent on the rent roll. If they don't, find out why before you go further.
And if the offering memorandum numbers don't match the T12, I go with the T12.
How MFA-ADVANCED does these checks for you
Every example above came from one tab: T12 Analytics in MFA-ADVANCED. I built it to run this exact process in one place.

Paste in the seller's T12 and map it. Then T12 Analytics shows you:
T-1, T-3, T-6 and T-12 side by side, in total dollars or per unit, with a plain read of every line.
Key figures: effective gross income, NOI, market rent, economic occupancy, operating expenses per unit and expense ratio.
Income bands: loss to lease, vacancy, concessions, bad debt and other income, each checked against the range for a stabilized property.
Expense bands: every expense per unit against its normal range, with lines that run hot flagged in red.
Monthly behavior: T-3 against T-12 for expense ratio and economic occupancy, the utilities seasonal swing, the concession trend, and NOI, effective gross income and income losses month by month.
It is the colored-months check, the per-unit check and the income-quality check… done before you finish your coffee.
And if you add the MFA AI Companion, you can upload the seller's T12 as an Excel file or a PDF. It is categorized and mapped into your MFA-ADVANCED model in about 45 seconds. You still check its work. It drafts and flags. You decide.
👉 See everything in MFA-ADVANCED
Start free
Want to practice on your next deal first? MFA-FREE is a full underwriting model in Excel, with the same engine as MFA-ADVANCED. You also get the free underwriting checklist.
Common questions
What is a T12 in real estate?
A T12, or trailing twelve months, is a property's operating statement for the last 12 months. It shows income and expenses month by month, with a 12-month total and net operating income (NOI).
What is the difference between a T12 and a T3?
A T12 uses all 12 months. A T3 annualizes the last three months (× 4). T3 income shows where the property is today. T12 expenses smooth out bills that are paid once or twice a year.
What is a good expense ratio for an apartment building?
It depends on the market, the age of the property and occupancy. That is why I compare expenses per unit instead. As a rough guide, total operating expenses often land between $7,000 and $10,000 per unit per year.
What is a RUBS ratio?
RUBS is a ratio utility billing system: tenants are billed back for part of the utilities. The RUBS ratio is the amount billed back divided by the utility cost. Around 80–90% is normal. Over 100% means tenants are being over-billed.
Should I trust the broker's numbers?
Use them as a starting point, not as the answer. When the offering memorandum and the T12 disagree, go with the T12. Then test the T12 with the checks above.


